- Analytical Ultracentrifugation (AUC)
- AUC in principle
- AUC – a versatile instrument
- Properties accessible with AUC
- Linking AUC with other methods
- Historic method, modern trends
- AUC for custom measurements
1. Analytical Ultracentrifugation (AUC)
Powerful tool for colloid and polymer analysis
For more than 90 years, Analytical Ultracentrifugation (AUC) has been contributing valuable services in the fields of biochemical and colloidal sciences. The widespread applications of AUC in chemistry, biochemistry and pharmaceutical science involve – among others – determination of molar masses, molar mass distributions, particle size distributions and particle density distributions.
Particles, coils, micelles, molecules – any dispersed or solute particles can be subjected to analysis in the AUC, as long as they sediment or float in the sedimentation field.

At a maximum angular velocity of 60000 rpm, an AUC will develop sedimentation fields equivalent to the Earth’s gravity 260000 fold. Exposed to this field, almost any particles will be forced to sediment or float. This process is monitored with optical systems and then evaluated in respect to particle properties.
Commercially available AUC are typically equipped with absorbance and interference detectors. Furthermore, fluorescence and multiwavelength absorbance detectors are in use; Raman turbidity and light scattering detectors are being developed. Traditional Schlieren optics are no longer available.
2. AUC in principle
AUC fractionates by size, density and shape. The principle of measurement is an everyday experience: such as a large object sinking to the bottom of a liquid faster than a small one, a steel object faster than one of aluminum, a compact sphere faster than a rod or a coil of the same mass. In this manner, AUC fractionates by particle mass, density, and shape.

During sedimentation, the sample chamber is screened parallel to the rotational axis. The image shows a classical absorbance detector. As a primary result, a concentration profile along the radial axis of the sample cell is obtained; repeated measurements during proceeding sedimentation yield time-resolved information. Multiple components will be separated in the course of sedimentation.
The concentration profiles are then evaluated in respect to the information desired.
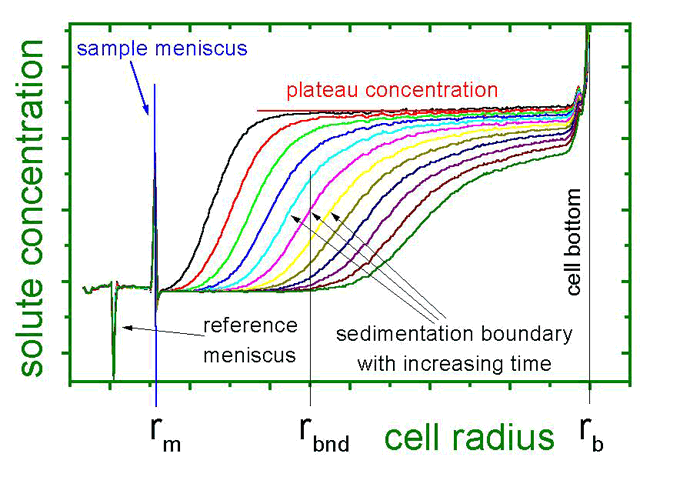
Locally resolved concentration profiles as detected by the AUC are displayed. From the meniscus, an increasing depletion of particles is observed. The material is accumulated at the cell bottom. At the sedimentation boundary, particle concentration increases steeply.
From the velocity of sedimentation boundary movement towards the cell bottom, particle properties can be calculated. For multimodal systems, multiple sedimentation boundaries are observed.
Apart from sedimentation, the dispersed particles also experience diffusion. Back diffusion increases with accumulation of material at the cell bottom, to eventually reach an equilibrium between sedimentation and diffusion. The so called sedimentation diffusion equilibrium provides an independent access to particle properties, since transport processes are eliminated. Often enough, the process of sedimentation delivers enough information for analysis so that equilibrium need not be attained.
3. AUC – a versatile instrument
AUC is an absolute method; no calibration is required and no interactions with a stationary phase take place. Arbitrary solvents, even aggressive or highly viscous chemicals, can be applied. Little amounts of substance and solvent are required, which makes this method attractive especially for biochemical applications.
A list of basic experiments shows the remarkable versatility of the AUC:
- sedimentation velocity
- sedimentation equilibrium
- density gradient
- synthetic boundary
In addition, variations to all experiments can be designed for special needs and situations.
Targets are as diverse as the methods: particles may be analysed within a range from several nanometers to micrometers, corresponding to molar masses of several thousands to millions of g/mole. Organic solvents, acidic or basic systems present no obstacle, nor do highly viscous samples. The optimal material for measurement cells is titanium; more common are aluminum or charcoal-filled epon centerpieces, sufficient for most aqueous applications. Cuvette windows are made of quartz or sapphire.
The crucial element of AUC is detection. The common combination of (specific) absorbance and (unspecific) interference detection will not only allow to analyse the majority of systems, it also allows to discriminate components by means of their spectroscopic properties. Yet more powerful is multiwavelength absorbance detection, registering complete spectra rather than single wavelength intensities.
4. Properties accessible with AUC
Basically, two transport processes take place in the Analytical Ultracentrifuge: sedimentation and diffusion. Sedimentation is governed by particle density and friction. Diffusion, however, is independent on particle density. Only particle size has influence on particle diffusion. Thus, the particle properties in question may be reduced to questions of density, mass and the frictional ratio.
All processes taking place in the Analytical Ultracentrifuge are covered by the Lamm equation, a differential equation already developed in 1929.
\frac{\partial}{\partial r} \left[ r \cdot D \, \frac{\partial
c}{\partial r} – s \, \omega^2 \, r^2 \, c \right]\)
Although there is no analytical solution to the Lamm equation, it is the basis of all evaluation methods. It contains the transport properties named above in the sedimentation constant \(s\) and the diffusion constant \(D\). The term \(r\) is a local coordinate giving the distance from the axis of rotation and \(ω\) is the rotor’s angular velocity.
A particle in a sedimentation field is exposed to three forces: a centrifugal force, a bouyant force and friction. Whereas the centrifugal force is independent of particle properties, bouyancy is governed by particle volume and density, and friction by particle size and shape. This is the set of variables that describe directed particle motion in a sedimentation field.

The Svedberg equation combines the transport properties \(s\) and \(D\) with the particle properties mass \(M\) and density \(v ̄\).
M = \frac{s \, R \, T}{D \left( 1 – \bar v \, \varrho \right)}\)
The frictional properties of the particle are expressed by the diffusion constant. The Svedberg equation is the foundation for most AUC experimental evaluations.
4.1 The primary result: Sedimentation velocity
In a sedimentation velocity experiment, a concentration gradient within the sample cell is recorded. Without prior assumptions, this profile can be converted into the sedimentation coefficient distribution (\(s\) distribution).
Sedimentation coefficients give a measure for the time a particle needs to cover a certain distance if exposed to a standardized sedimentation field. This is the primary experimental result; no information is retrieved as to which particle properties result in this sedimentation velocity.

Useful information is already contained in this primary result: the sedimentation coefficient distribution gives the number and concentration of components, sample homogenity, aggregates and polydispersity. Often enough, this experiment is already sufficient to solve the analytical problem in question.
4.2 Particle size
One of the most important particle characteristics in colloidal science is the particle size distribution (PSD) that can be obtained directly from the \(s\) distribution.

For this conversion, particle density is required. If it is unknown, an AUC density variation experiment or an other method can be used to obtain this parameter. For spherical, compact particles, direct calculation of the diameter is possible. In other cases, further assumptions or information may be required.
Even smallest colloid particles can be characterized in Ångström resolution.
4.3 Particle densities and density distributions
Particle size distributions can also be calculated for heterogenous or unknown particle densities. In this case, the procedure of density variation is applied where particles sediment in two solvents of different density. Comparing the resulting data yields a density distribution for all detected particles.
The density variation technique may be applied both for sedimentation velocity and sedimentation equilibrium. In equilibrium, weight averages for the density and the molar mass are obtained; in sedimentation velocity, the experiment results in simultaneous determination of particle size and particle density distributions.

4.4 Molar masses and molar mass distributions
Measuring molar masses is a classical AUC application. Two methods are available: sedimentation equilibrium yields molar mass averages whereas sedimentation velocity results in molar mass distributions.

Sedimentation equilibrium is attained when sedimentation to the cell bottom and back diffusion reach a stationary state. No transport processes take place any more, and a molar mass will be derived independently of sedimentation and diffusion constants.
For this reason, error bars are below 3% which makes this method a very reliable one. Today, sedimentation velocity experiments can be conducted with comparable precision. However, sedimentation equilibrium is mostly better suited when investigating systems containing very small, thus rapidly diffusing particles. This complicates the evaluation of sedimentation velocity experiments whereas equilibrium is reached in reasonable time.
In sedimentation equilibrium, multiple species will sum up in one concentration profile, thus requiring assumptions, e. g. concerning number and relative concentration of involved species.
For this reason, we prefer the \(M\)* function for evaluation. \(M\)* is model independent and provides diagnostic information that helps select an appropriate model for the system without introducing assumptions at an early state of evaluation.
Due to particle interactions, it is necessary to carry out concentration series measurements in sedimentation equilibrium. The concentration dependency is then obtained in the Second Osmotic Virial Coefficient.

From sedimentation velocity, molar mass distributions are obtained. However, the particle densities and frictional ratios for all species are required for evaluation.
4.5 Particle shape and particle swelling
A particle’s sedimentation velocity contains information on its fricional properties, most commonly given by the frictional ratio \(f/f_0\). The frictional ratio can be calculated from AUC data using equation.
\frac{f}{f_0} = \frac{M \left( 1 – \bar v \varrho_0 \right)}{N_A \cdot 6 \pi \eta_0 s^2_{20, w}}
\cdot \sqrt[3]{\frac{4 \pi N_A}{3 \bar v M}}.\)
\(f/f_0\) is unity for compact spheres. The frictional ratio is higher for nonspherical particles; the axis ratio for ellipsiods of revolution can be calculated from \(f/f_0\) for a given molar mass. A full scale characterisation of a nonspherical particle can be achieved by combining sedimentation equilibrium (\(M\)) and sedimentation velocity \((f/f_0)\)data.
Swollen particles also exhibit frictional ratios greater than 1, allowing hydration to be calculated from sedimentation velocity data. The more complex the particle, the more information is required for full characterization. Various AUC experiments as well as orthogonal methods offer a large number of options to obtain a complete set of variables and thus describe particles of high complexity.
4.6 Interactions
In AUC experiments, interparticle interactions are found
- in the concentration dependency of sedimentation coefficients
(\(k_s\), sedimentation velocity), - in the concentration dependency of the apparent molar mass
(\(A_2\), sedimentation equilibrium).
From concentration series, valuable information on particle interactions is derived. The corresponding parameters can be combined with related parameters from independent methods.
Dissociation constants of aggregating systems can also be obtained in this manner.
4.7 Diffusion
As can be seen from the Lamm equation, the transport processes of sedimentation and diffusion are always coupled. Often, diffusion complicates evaluation as it leads to broadening of the obtained distributions. Traditionally, influence of diffusion was suppressed to some extent by appropriate experimental conditions and evaluation procedures, a modus operandi still reasonable in many cases nowadays.
On the other hand, the two processes follow different orders of time, making it possible to separate them mathematically. Modern computers and algorithms allow for global fits, modelling diffusion and sedimentation processes at the same time. Thus, diffusion has mutated from an interfering process to a source of information.

Although diffusion coefficients can be obtained from dynamic light scattering with less effort, there are cases where the AUC is still used for determination of \(D\) today.
4.8 … and lots more
It is apparent that the versatility of AUC permits far more applications than could be listed here. For instance, it can be used as a pressure generator to force separation of emulsions under high pressure and thus to determine and compare stabilities much faster than with routine methods. Another application is to de-swell gels, giving access to their thermodynamic properties.
The AUC’s optical systems can be used in a versatile way as well. Different species with different absorbance or refractive properties can be registered independently in one experiment. Different spectroscopic properties of multiple components will even allow for orthogonal discrimination in the very same experiment (”multiplex analysis”).
AUC offers a broad platform for the user’s creativity. Not only a vast variety of dispersed systems is accessible, but also complex objects, such as capsids – empty or loaded with cargo – , self-assembling structures, core-shell-particles and many more.

5. Linking AUC to other methods
Being a hydrodynamic absolute method, AUC can be combined excellently with other methods. Since its measurement results are not dependent on any calibration, but obtained from fundamental hydrodynamic laws (”ab initio”), the results can be compared or linked with other methods.
This applies even more as AUC addresses a particularly extensive set of hydrodynamic parameters. Among these, the interaction parameters \(k_s\) and \(A_2\) are of special importance, when being related to other methods and their interaction-related parameters. For instance, the interaction parameter \(A_2\), obtained from a series of sedimentation equilibria, is identical to the Second Osmotic Virial Coefficient \(A_2\) from static light scattering.
The combination with viscometry is particularly productive. By means of hydrodynamic shape functions, axial ratios of non spherical particles can be determined. Examples are the functions \(ν\), \(P\), and \(R\):
\nu = \frac{[\eta]}{v_s}\)
P = \frac{M \left( 1 – \bar v \varrho_0 \right)}{N_A \cdot 6 \pi \eta_0 s^0_{20, w}}
\cdot \sqrt[3]{\frac{4 \pi N_A}{3 \bar v M}} \cdot \sqrt[3]{\frac{1}{\frac{w}{\bar v \varrho} + 1}}\)
R = \frac{k_s}{[\eta]} \approx \frac{2 \left( 1 + P^3
\right)}{\nu},\)
These functions take on defined values for certain axis ratios. The variables contained are all accessible by AUC except for the intrinsic viscosity \([η]\) available from viscometry. For swollen particles, the partial specific volume \(v_s\) is different from \(v ̄\), the partial specific volume of the solid material. \(v_s\) can also be expressed by terms of \(w\), the hydration parameter. When dealing with swollen particles of unknown solvent content, hydration independent functions can be used, e. g. the molar mass calculation according to Lavrenko or the \(Π\) function.
M = N_A \cdot \sqrt{\left( \frac{6 \pi \eta s}{1 – \bar v \varrho} \right)^3}
\cdot \sqrt{ \frac{3 k’ [\eta] \bar v}{4 \pi k_s} \left(\frac{k_s}{2 \bar v} – \frac{k’ [\eta]}{k_s} \right)
};\)
\frac{v_s}{\bar v} = \frac{k’ [\eta]}{k_s},\)
\Pi \approx \frac{2 A_2 M}{[\eta]},\)
These functions use other particle properties in order to obtain a complete set of variables. The concentration dependence of sedimentation velocity \(k_s\) or the Second Osmotic Virial Coefficient \(A_2\) can be measured with AUC experiments.
Though being highly compatible with other hydrodynamics-based methods, AUC exhibits a unique feature: It is the only method to fractionate on the basis of the force produced by mass in a field of gravity – and the only method capable of measuring distributions of densities.
6. Historic method, modern trends
AUC has been playing its part in biochemistry and colloid science for 100 years now. This is intriguing for a modern physics based method. Still, AUC is continuously subject to new technological and methodical enhancements.
In 1924, Thé Svedberg claimed that ”hemoglobin in solution most likely exhibits a molecular mass of 66800 – in four subunits of 16700.”
An early and spectacular breakthrough to be accredited to AUC.

Ever since, AUC has unraveled countless questions in decades of application in research. Among them are such that ultimately led to Nobel prizes – such as the structural resolution of DNA. In the past decades, it has also found new tasks in colloid science – its original field of application.
In addition, AUC benefits from the general technological progress in the fields of photonics and electronics. After decades of stagnation ever since absorbance and interference optics were introduced, several modern detectors have been developed since
2010 – most notably the multi-wavelength absorbance and -emission detectors, bearing the enormous potential of adding a spectral dimension to the measurement results. In addition, fluorescence and interference detectors have been improved, and further detectors (Raman, turbidity, scattering) are under development or already existent as prototypes.

The greatest advance, however, is that by means of modern computers and algorithms, it has become possible to perform global fits to the totality of the measurement data. This development has revolutionized AUC – and still holds great potential.
7. AUC for custom measurements
An analytical ultracentrifuge is expensive. In addition, its opera- tion requires expertise and experience. It is therefore feasible to operate this method in contract measurements.
Nanolytics was the first contract laboratory in Europe to focus on Analytical Ultracentrifugation. For more than 20 years, Nanolytics has been offering not only measurements on high quality equipment, but also extensive expertise in experimental design and thorough evaluation of measurement results.
Nanolytics operates the most advanced detectors, including Multiwavelength Absorbance Detection and the Aida detector (Advanced Interference Detection Array) by Nanolytics Instruments. This allows for measurements in much more dilute and concentrated systems than with commercially available detectors.
This high-quality and unique equipment in combination with a skilled and experienced team guarantees best results – whether for routine questions or for the characterization of complex systems.